Performance can make or break a web application, especially at scale. A React app that felt “snappy” in development might slow to a crawl in production when faced with large data, complex state, and thousands of users. As a Senior Engineer, you’re expected to diagnose and resolve these issues across sprawling codebases. Lets dive deep into real-world React performance tuning strategies – from reducing re-renders and memory leaks to advanced profiling and Next.js optimization – all aimed at eliminating bottlenecks in large-scale React/Next.js applications. We’ll explore practical techniques like memoization, using the React Profiler and flamegraphs, caching with React Query, and even a case study showing how targeted fixes can dramatically improve load times and responsiveness. Let’s get started with the fundamentals of avoiding wasted work in React’s rendering process.
Reducing Re-renders, Memory Leaks, and Layout Shifts
Performance issues often start with inefficient rendering and resource usage. In a large React app, unnecessary re-renders or memory leaks can compound into significant slowdowns. Similarly, layout shifts (unexpected movement of UI elements) can degrade user experience and Core Web Vitals scores. This section covers how to optimize component rendering, properly manage side-effects to prevent leaks, and stabilize your UI’s layout.
Optimizing Component Rendering with Memoization (React.memo, useMemo, useCallback)
Unnecessary re-renders are a common performance killer. React’s virtual DOM diffing is fast, but if components keep re-rendering without need, CPU time and battery life are wasted. Memoization is a key strategy to reduce redundant renders:
React.memo for components: Wrap functional components with React.memo to memoize their output. React will skip re-rendering the component if its props haven’t changed (shallow comparison). This is similar to making a class component PureComponent. It’s especially useful for expensive components or large subtrees that don’t need to update on every parent render.
useMemo for values: Use the useMemo hook to cache expensive calculations between renders. It returns a memoized value and only recomputes when its dependencies change. For example, const cachedValue = useMemo(calculateValue, [deps]) will cache the result of calculateValue until deps change
useCallback for functions: Similar to useMemo, useCallback(fn, [deps]) returns a memoized callback function. If you pass callbacks as props to child components, wrapping them in useCallback can prevent child components from re-rendering due to a new function reference on each parent render. This pairs well with React.memo – e.g., a memoized child that receives an event handler prop should get a stable function reference via useCallback to avoid triggering re-renders.
Avoiding unnecessary state updates: Often, re-renders happen because state changes that don’t actually impact the UI are still being done. Review your state usage – if a piece of data can be derived from props or other state, don’t duplicate it in a separate state variable. Likewise, batch multiple state updates together when possible (React batches updates in event handlers automatically) to avoid triggering sequential re-renders. Check your use of context and Redux as well – updating a large context or global state for minor changes can force many components to re-run render. Use selector functions or split state slices to localize updates. By minimizing pointless state changes, you naturally reduce render frequency.
Avoiding Memory Leaks in Effects and Event Handlers
Memory leaks in React apps typically occur when we attach long-living listeners or asynchronous operations that aren’t properly cleaned up. Over time, leaks bloat memory usage and can slow down or crash an application. Common culprits include:
Event listeners not removed: Attaching events to global objects (window, document) or subscribing to external services (like WebSocket, DOM events) in useEffect without removing them on cleanup can leak memory. Always return a cleanup function in useEffect that removes listeners or subscriptions. For example:
Timers and async operations: Functions like setTimeout or setInterval can keep running even after a component unmounts, unless cleared. Use the cleanup to cancel timeouts/intervals (via clearTimeout/clearInterval). Similarly, if you initiate an asynchronous fetch, consider cancelling it if the component unmounts (e.g., using an AbortController for fetch or aborting an Axios request). This prevents setting state on an unmounted component and leaking the promise.
Dangling references: Storing large data in closures or refs that outlive the component can cause memory to be retained. For instance, if you push data into a ref or a global store and never remove it, it will accumulate. Be mindful of caches or in-memory stores and periodically prune or reset them if they grow indefinitely. Also, avoid updating state in an unmounted component (React will warn “Can’t perform a React state update on an unmounted component”) – that often indicates a leak or an operation that wasn’t cleaned up. In summary, always clean up your effects. React’s functional paradigm makes it easy to forget that something started in an effect may still be active later. A proper cleanup ensures that event listeners, subscriptions, and timers don’t live past their intended life, preventing memory leaks and keeping your app’s performance stable
Minimizing Layout Shifts (Stabilize the UI)
Layout shifts refer to visible movement of elements on the page (a poor user experience measure tracked by the Cumulative Layout Shift (CLS) metric). Frequent or large layout shifts can make your app feel janky. They often happen when content is loaded asynchronously without reserving space, causing the layout to “jump”. Here’s how to minimize them:
A hell lot of jumping for an easy vanilla cake
Reserve space for images and media: One of the most common causes of layout shifts is images loading in and pushing content down. Always specify width and height (or an aspect ratio box via CSS) for images and videos. By reserving the correct space, the browser can lay out the page without sudden adjustments when the media loads. Modern Next.js Image component enforces this by requiring width/height or using layout="responsive" (and it uses a placeholder SVG to occupy space). If using plain <img>, set the width and height attributes or CSS dimensions. This ensures lazy-loaded images don’t unexpectedly move content
Avoid inserting content above existing UI: If you dynamically load content (like ads, notifications, or infinite scroll lists), try to insert it in a way that doesn’t shove existing content. For example, append new list items below the current content for infinite scroll, rather than prepending above. If content must appear above, consider using position overlays (absolute/fixed positioning) so it doesn’t affect document flow, or at least add a placeholder element in advance.
CSS and font considerations: Large layout shifts can also occur due to custom font loading (FOUT/FOIT issues) or CSS changes. Use font-display: swap for web fonts so text remains visible (avoiding sudden flash when font loads). Minimize heavy layout-changing CSS animations; prefer transform animations (translate, scale) which don’t trigger reflow. Also, avoid forcing reflow by reading and writing layout in rapid succession (the classic layout thrashing problem) – batch your style reads/writes or use the browser’s requestAnimationFrame.
Use skeletons or placeholders: For sections of the UI that load asynchronously (like a component that fetches data), use a skeleton screen or placeholder of fixed size. This maintains the layout structure while data is loading, so when the real content arrives, it simply replaces the placeholder without shifting other elements. Next.js 13’s Suspense boundaries and fallback components can help orchestrate this, ensuring loading states don’t wreck the layout.
By addressing re-renders, leaks, and layout shifts, you build a solid foundation for performance. Next, we’ll turn to tools that help measure and pinpoint performance problems: the React Profiler and flamegraphs.
Advanced React Profiler & Flamegraph Debugging
When an app grows complex, it’s not always obvious where the bottlenecks are. React may be doing extra renders deep in the component tree, or a particular component may be slow to update. The React Profiler (built into React DevTools) is an indispensable tool for diagnosing such issues. It records render timings and helps visualize them with flamegraphs – a critical technique for performance debugging. In this section, we’ll provide a step-by-step guide to using the Profiler, interpreting flamegraphs, and leveraging utilities like why-did-you-render to catch unnecessary renders.
Using the React Profiler (Step-by-Step)
The React Profiler in the browser DevTools lets you record the rendering behavior of your application. Here’s how to use it to analyze performance:
Enable and start recording – Open your app in Chrome (or any browser with React DevTools installed) and open DevTools. Navigate to the Profiler tab (it appears alongside Elements, Console, etc., when React is detected). Click the “record” 🟢 button to start profiling. Alternatively, there’s an option to start recording on page load (useful if you want to capture the initial render).
Reproduce the slow interaction – With profiling on, perform the actions in your app that you suspect are slow or causing issues. For example, navigate to a page that’s sluggish, or perform a series of actions (like typing into a search box that lags, or scrolling a list). The Profiler will capture every component render (mount, update) during this period.
Stop recording – Click the “stop” ⏹️ button. The Profiler will then process the recorded data and display a summary of commits (each render commit is a discrete timeline event in React’s reconciliation process). You’ll see a list or chart of commits, each with a render duration. If one interaction caused multiple re-renders (commits), they’ll be listed.
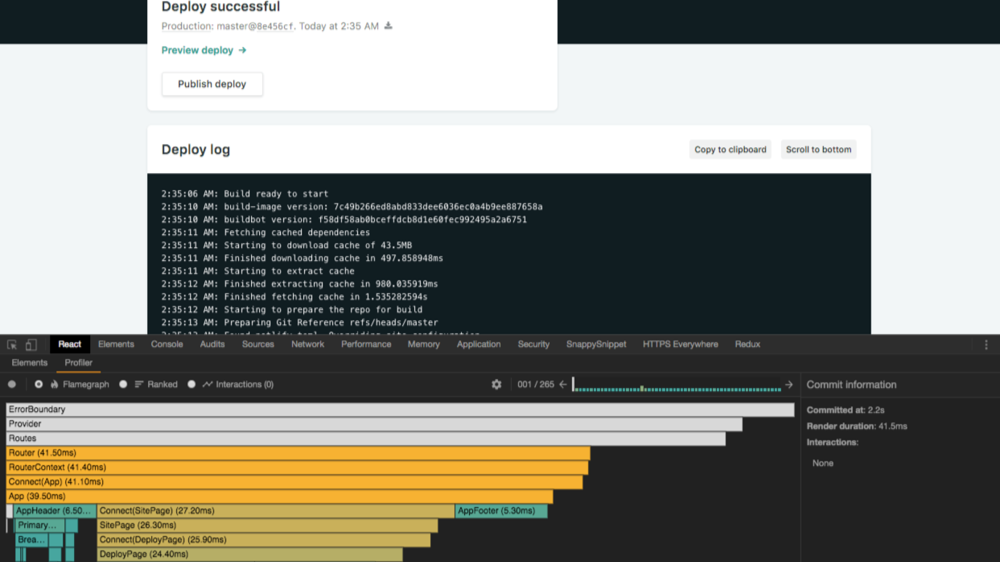
Analyze the flamegraph – Select a commit (for example, the one corresponding to the slow interaction). Switch to the Flamegraph view (also called the flame chart). Now you’ll see a visualization of your component tree for that commit, with each component represented as a bar. The width of each bar indicates how long that component (including its children) took to render, and color indicates relative time (e.g., yellow or orange bars took more time, blue/green bars took less)
Identify expensive components and why they rendered – Look for the longest bars (often highlighted in warmer colors). These are your prime suspects for optimization. The Profiler may also highlight (in the right-side detail panel) why a component rendered – for example, which state or prop changed. React 18+ DevTools can even show what changed between renders for a selected component (e.g., a certain state value changed) to hint at the cause. If you see a component re-rendering multiple times unnecessarily, note it down. You can also switch to the Ranked view, which lists components by total render time for that commit, to see aggregate costs.
By following these steps, you’ll have a clear picture of where time is being spent. For instance, you might discover that a seemingly minor component is re-rendering 50 times, or an expensive component is taking 200ms to render due to heavy computations. Armed with this info, you can focus your optimization efforts on the worst offenders.
Flamegraphs can initially be intimidating, but a few tips make them easier to interpret:
Top-down vs. bottom-up: The flamegraph is organized hierarchically. The top of the chart is your root (often <App> or <Provider>), and beneath it are nested children. If a parent component re-renders, generally all its descendants may appear. A very wide bar up top (spanning many children) could mean a parent component caused a large update. But sometimes a deep child can also be slow independently. Use the zoom feature: click on a component to zoom into that subtree, which filters out others. This helps isolate a deep component’s cost.
Self time vs. children time: The width of a bar includes the time of its children. The color usually indicates the self time (the component’s own render time excluding children). So a component might be wide (because its subtree is large) but colored green (meaning the component itself was fast, but its children took time). In the example in the figure above, the Router bar was as wide as the total commit (meaning the whole tree under Router took 18ms), and it was yellow because that whole section was slow. By contrast, you might see a component with a wide bar but mostly due to one slow child. The Profiler’s right panel will list the actual milliseconds for each component. Focus on components with high self-time or repeatedly rendering many times.
Re-render count: The Profiler also has a “Components” view (or chart) that shows how many times each component rendered during the profiling session. If you see a component rendered, say, 20 times for one user action, that’s a red flag. Perhaps an effect is causing continuous state updates or there’s an unnecessary use of a key causing remounts. Combine this info with flamegraph data: a component that renders many times and takes long each time is definitely a bottleneck.
Why did a component render?: When you click a component in the flamegraph, the detail panel often shows what caused it to render. For example, it might highlight that a prop changed from X to Y, or state X changed. This is immensely helpful – if a component re-rendered due to a prop that didn’t truly change in value (like an object prop that was recreated), you’ve found an opportunity to memoize or avoid passing that prop. Or if state changes that could be batched weren’t, you’ll see multiple commits that could potentially be combined.
The flamegraph and related views essentially guide you to which components to optimize. Once you know, for example, that ProductList and SidebarFilter are the slow parts (or re-rendering too often), you can focus your efforts there – perhaps by applying memoization, splitting a large component into smaller memoized ones, or moving expensive calculations out of render.
Using “why-did-you-render” to Catch Unnecessary Renders
While the React Profiler shows you what happened, there’s a utility that can proactively warn you about unnecessary re-renders as you develop: why-did-you-render. This open-source library monkey-patches React to log whenever a component re-renders for no good reason. It’s especially handy for large apps where it’s hard to manually track every component’s behavior.
To use it, you install the @welldone-software/why-did-you-render package and configure it to track components (usually in development mode only). For example, you might add at startup:
This config will automatically track all functional components that are “pure” (meaning they render the same output for the same props, like those wrapped in React.memo). Now, when running the app, if any such component re-renders but the props are deep-equal (no actual change in data), why-did-you-render will output a console log like: “[ComponentName] re-rendered because of props changes: prop X changed value equality”. It even shows the old and new values (often identical by value but different by reference, e.g. two object literals that are deep-equal but not the same reference). This is gold for catching issues such as: passing inline objects/arrays as props, or needless parent re-renders that cascade down.
For instance, why-did-you-render might point out: “MainComponent was re-rendered because of props changes. The prop ‘style’ changed value equality: {paddingTop: 350} !== {paddingTop: 350}.” This indicates an anti-pattern where a new object is being created each render, causing a memoized child to think props changed. The fix could be to memoize that object (e.g., use useMemo or define it outside the component) or to adjust the component to accept primitive values instead. In large enterprise apps, these patterns (inline object props, etc.) are common sources of unnecessary renders. Why-did-you-render essentially automates the process of finding them.
Note: Only use why-did-you-render in development – it patches React and can impact performance or even cause issues if left in production. It’s a development helper. Use it to identify trouble spots, fix them, and remove or disable it for the prod build.
Optimizing Expensive Computations
Profiling might reveal that some components are slow not because of too many renders, but because of heavy work done during render. JavaScript on the main thread can block the UI, so any expensive computation in a render (or in hooks that run during render) will hurt performance. Strategies to handle this include:
Move work outside render: If possible, do heavy data processing before setting state. For example, instead of storing raw data in state and sorting/filtering it in the component each time, compute the sorted data once when fetching (or in a web worker) and then store the already-processed result. Then the render just displays it.
Use useMemo for heavy calculations: As mentioned, wrap expensive calculations in useMemo so they only redo when necessary. E.g., const processedData = useMemo(() => crunchNumbers(bigDataset), [bigDataset]);. Ensure the dependency array is correct so it recalculates when needed (e.g., when bigDataset changes) but not on every render. This way, even if the component renders often (maybe due to some parent state), the costly computation isn’t repeated unless the input data changed. This can dramatically improve render times if used appropriately.
Throttle or defer non-urgent updates: React 18 introduced useTransition which allows marking state updates as “transitions” (non-urgent). If you have a state update that triggers a heavy render (like typing into a filter that re-renders a huge list), you can defer it so that the UI stays responsive (React will show the previous UI until the transition is ready). Also consider debouncing input handlers – e.g., if a filter triggers a heavy search operation, don’t do it on every keystroke, but wait for the user to pause typing (e.g., 300ms debounce). This reduces how often the expensive work runs.
Web Workers for truly heavy tasks: If you have computations that take hundreds of milliseconds or more (like image processing, complex calculations, or large JSON parsing), offload them from the main thread. Use Web Workers to run such logic in the background. The UI can show a spinner or progress, and then update state when the worker returns the result. This way the render thread isn’t blocked.
By combining React’s memoization and these general JS techniques, you can eliminate most computation-related bottlenecks.
Conclusion
Optimizing React performance at scale is a challenging but rewarding endeavor. We’ve covered how to reduce unnecessary work and how to use tools to zero in on problems. The key is to be proactive in writing efficient code (using memoization, cleaning up effects, designing for performance) and reactive in profiling and fixing bottlenecks that emerge.
For Staff and Senior Engineers, performance tuning is often about seeing the big picture – understanding how a seemingly small inefficiency can ripple through a massive codebase – and systematically eliminating those hotspots. It’s also about mentoring the team on best practices so that performance is considered at design time, not just after issues arise.
In practice, always remember to measure and validate improvements with real metrics. Users care about results: faster loads, smoother interactions, and no nasty surprises like memory bloats. By applying the techniques outlined above, you can greatly improve your React app’s performance, resulting in happier users, better business outcomes (conversion rates, engagement), and a codebase that scales gracefully.
Performance tuning is an ongoing journey, but armed with the right tools and approaches, it’s a journey where each step yields a more robust and delightful application. Happy optimizing!
The glorious goal of our existence.
Would love to hear—what’s the biggest performance challenge you’ve faced in React and what strategies worked best for you? Let’s discuss.