From EDA to Impact: Understanding Variable Interactions Before Modeling
Having a big dataset gives you the strength to build model reliability and generalize patterns across diverse populations. A reliable model depends on having enough data, ensuring high data quality, and including relevant features that truly reflect the problem space. Large volumes of clean, well-structured data support the model in learning real-world variability and making robust predictions. However, when the goal is to explore how different variables interact without predefined outcomes, analyzing a smaller, focused dataset allows for clearer pattern discovery and deeper insight into relationships among metrics.
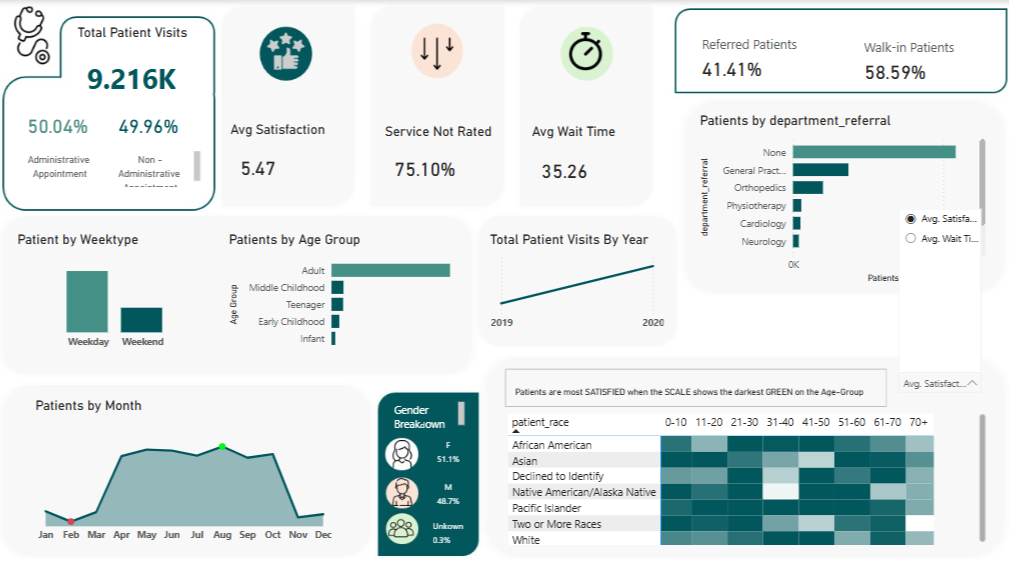
Hence, as a foundation for my unsupervised machine learning project this semester, I began by working with a smaller, structured healthcare dataset to explore patterns in hospital operations and patient behavior. This allowed me to understand key interactions between variables such as patient demographics, wait times, satisfaction scores, and referral types—factors that are highly relevant to respiratory-related hospital visits. These early insights helped inform the features to focus on as I scale up with my team to the larger Weekly Hospital Respiratory Data (HRD) Metrics by Jurisdiction from the National Healthcare Safety Network (NHSN).
Recommended by LinkedIn
While working with this emergency room dataset, I uncovered two important takeaways that highlight both the challenges and potential in analyzing healthcare data:
Two core Power BI features—Power Query for data cleaning and DAX for creating custom measures like average wait time and satisfaction scores—played a major role in shaping my analysis and insights.
Looking forward to building on these insights and learning even more as I dive deeper into the next phase of the project !


Great insights. Kudos to you!
I love the color palette and the way insights have been shown. Great dashboard Suhasini Singh Indeed, making sense of smaller datasets and building dashboards out of it is pretty hard. Great job 👏